Spring Boot Actuator将监控指标导出到InfluxDB和Prometheus


Spring Boot Actuator是Spring Boot 2.x发布后修改最多的项目之一。它经历了重大改进,旨在简化定制,并且添加了支持其他Web技术的新特性,例如反应式模块——Spring WebFlux。它还为InfluxDB添加了开箱即用的支持,InfluxDB是一个开源的时间序列数据库,旨在处理大量带时间戳的数据。与Spring Boot 1.5使用的版本相比,它确实简化了不少。通过阅读我的前一篇文章使用Grafana和InfluxDB自定义指标可视化,就可以看出这篇文章的价值。我在那篇文章中描述了如何使用@ExportMetricsWriter bean将Spring Boot Actuator生成的指标导出到InfluxDB,示例Spring Boot应用程序可在GitHub仓库中sample-spring-graphite的master分支上找到。对于本文,我新建了分支spring2,用来展示如何使用Spring Boot 2.0和Spring Boot Actuator实现与之前相同的功能。
另外,我将展示如何导出相同的指标到另一个流行的监控系统——Prometheus,以便高效地存储时间序列数据。在InfluxDB和Prometheus之间导出指标的模型之间存在一个主要区别。influxDB是基于push方式,而Prometheus是基于pull的方式。因此,示例程序需要主动将数据发送到InfluxDB监控系统,而使用Prometheus时,只需要暴露定期获取数据的端点即可。先从InfluxDB开始吧!
1.运行InfluxDB
在上一篇文章中,我并没有写太多关于这个数据库及其配置的内容。所以,现在我稍微写一下。第一步是我的例子中的典型步骤——运行带有InfluxDB的Docker容器。这是在本地计算机上运行InfluxDB并在8086端口上公开HTTP API的最简单命令。
$ docker run -d --name influx -p 8086:8086 influxdb
当启动了容器后,你可能想要登录并且执行一些命令。没什么比这个更简单,只需运行以下命令即可。登录后,可以在目标Docker容器上看到InfluxDB版本。
$ docker exec-it influx influxConnected to http://localhost:8086 version 1.5.2InfluxDB shell version:1.5.2
你可能猜到了,第一步就是要创建数据库。使用命令
create database来实现。然后切换到新创建的数据库。$ create database springboot$ use springboot
是不是似曾相似?没错,InfluxDB提供了与SQL非常相似的查询语言,它被称为InfluxQL。允许您定义SELECT语句,GROUP BY或INTO子句等等。但是,在执行这些查询之前,我们应该将数据先存储在数据库中,对吧?现在继续下一步,来生成一些用于测试的指标。
2.Spring Boot与InfluxDB集成
如果您将组件micrometer-registry-Influx包含在项目的依赖项中,则会自动启用对InfluxDB的导出。当然,我们还需要包含spring-boot-starter-actuator。
<dependency><groupId>org.springframework.boot</groupId><artifactId>spring-boot-starter-actuator</artifactId></dependency><dependency><groupId>io.micrometer</groupId><artifactId>micrometer-registry-influx</artifactId></dependency>
你唯一要做的就是覆盖InfluxDB的默认地址,因为我们在VM上运行InfluxDB Docker容器。默认情况下,Spring Boot Data会尝试连接名为mydb的数据库。但是,我已经创建了数据库springboot,所以我也应该覆盖这个默认值。在Spring Boot2.x版本中,与Spring Boot Actuator端点相关的所有配置属性都已移至management.*。
management:metrics:export:influx:db: springbooturi: http://192.168.99.100:8086
启动Spring Boot应用程序后,你可能会感到惊讶,它默认只显示两个HTTP端点:
/actuator/info和 /actuator/health。出于安全考虑,在最新版本的Spring Boot中,除 /health和 /info之外,所有端点默认都是禁用状态。要启用所有actuator端点,可以将属性 management.endpoints.web.exposure.include设置为'*'。在最新版本的Spring Boot中,HTTP指标的监控得到显著提升。我们可以通过将属性
management.metrics.web.server.auto-time-requests设置为 true来收集所有Spring MVC指标。或者,当它设置为false时,您可以通过使用 @Timed对其进行注解,来启用特定REST控制器的指标。还可以在控制器内注解单个方法,以仅为特定的端点生成指标。应用程序启动后,您可以通过调用端点
GET/actuator/metrics来查看生成指标的完整列表。默认情况下,Spring MVC控制器的指标以名称 http.server.requests生成。可以通过设置 management.metrics.web.server.requests-metric-name属性来自定义此名称。如果你运行我的GitHub仓库中可用的示例应用程序,则默认情况下可以使用端口2222.现在,您可以通过调用端点 GET/actuator/metrics/{requiredMetricName}来查看为单个指标生成的统计信息列表。如下图所示:
3.构建Spring Boot应用程序
用于生成指标的示例Spring Boot应用程序由单个控制器组成,该控制器用于操作Person entity,repository bean和实体类的基本CRUD操作。应用程序使用提供CRUD实现的Spring Data JPA Repository 连接到MySQL数据库。以下是控制器类:
@RestController@TimedpublicclassPersonController{protectedLogger logger =Logger.getLogger(PersonController.class.getName());@AutowiredPersonRepository repository;@GetMapping("/persons/pesel/{pesel}")publicList findByPesel(@PathVariable("pesel")String pesel){logger.info(String.format("Person.findByPesel(%s)", pesel));return repository.findByPesel(pesel);}@GetMapping("/persons/{id}")publicPerson findById(@PathVariable("id")Integer id){logger.info(String.format("Person.findById(%d)", id));return repository.findById(id).get();}@GetMapping("/persons")publicList findAll(){logger.info(String.format("Person.findAll()"));return(List) repository.findAll();}@PostMapping("/persons")publicPerson add(@RequestBodyPerson person){logger.info(String.format("Person.add(%s)", person));return repository.save(person);}@PutMapping("/persons")publicPerson update(@RequestBodyPerson person){logger.info(String.format("Person.update(%s)", person));return repository.save(person);}@DeleteMapping("/persons/{id}")publicvoid remove(@PathVariable("id")Integer id){logger.info(String.format("Person.remove(%d)", id));repository.deleteById(id);}}
在运行应用程序之前,我们设置了MySQL数据库。最方便的方法是通过MySQL Docker镜像实现它。这是运行带有数据库grafana容器的命令,定义用户和密码,并暴露MySQL5的端口33306。
docker run -d --name mysql -e MYSQL_DATABASE=grafana -e MYSQL_USER=grafana -e MYSQL_PASSWORD=grafana -e MYSQL_ALLOW_EMPTY_PASSWORD=yes -p 33306:3306 mysql:5
然后我们需要在应用程序端设置一些数据库配置属性。所有必需的表都将在应用程序启动时创建,这要归功于设置属性
spring.jpa.properties.hibernate.hbm2ddl.auto为 update。spring:datasource:url: jdbc:mysql://192.168.99.100:33306/grafana?useSSL=falseusername: grafanapassword: grafanadriverClassName: com.mysql.jdbc.Driverjpa:properties:hibernate:dialect: org.hibernate.dialect.MySQL5Dialecthbm2ddl.auto: update
4.生成指标
在启动应用程序和所需的Docker容器之后,唯一需要做的就是生成一些测试统计信息。我创建了JUnit测试类,它生成一些测试数据并在循环中不断调用应用程序公开的端点。这是该测试方法的片段。
int ix =newRandom().nextInt(100000);Person p =newPerson();p.setFirstName("Jan"+ ix);p.setLastName("Testowy"+ ix);p.setPesel(newDecimalFormat("0000000").format(ix)+newDecimalFormat("000").format(ix%100));p.setAge(ix%100);p = template.postForObject("http://localhost:2222/persons", p,Person.class);LOGGER.info("New person: {}", p);p = template.getForObject("http://localhost:2222/persons/{id}",Person.class, p.getId());p.setAge(ix%100);template.put("http://localhost:2222/persons", p);LOGGER.info("Person updated: {} with age={}", p, ix%100);template.delete("http://localhost:2222/persons/{id}", p.getId());
现在回到第1步,你可能还记得,我已经向你展示了如何在InfluxDB Docker容器中运行influx客户端。经过几分钟的工作后,测试单元应多次调用暴露的端点。我们可以查看Influx上已存储
http_server_requests指标的数据。以下查询返回最近3分钟内收集的测量值列表。
正如你看的的那样,Spring Boot Actuator生成的所有指标都标有以下信息:
method, uri, status和 exception。通过这些标签,我们可以轻松地为每个信号端点分组指标,包括失败和成功的百分比。我们来看看如何在Grafana中配置和查看它。5.使用Grafana对指标可视化
一旦我们将成功的指标导出到InfluxDB,就可以使用Grafana将它们可视化了。首先,让我们用Docker容器运行Grafana。
$ docker run -d --name grafana -p 3000:3000 grafana/grafana
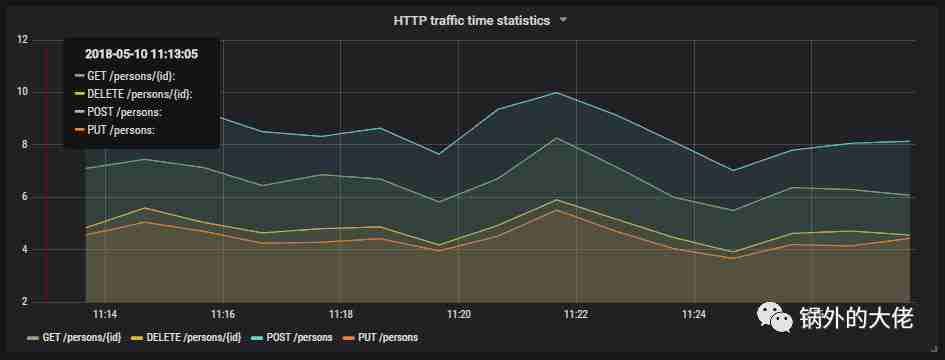
Grafana为创建Influx查询提供了用户友好的接口。我们定义了一个图表,它可视化了每个调用端点的请求处理时间和应用程序接收的请求总数。如果我们按方法类型和 uri筛选存储在表
http_server_requests中的统计信息,我们将收集每个端点生成的所有指标。
也要为其他端点创建类似的定义。用一张图来说明它们:

这是最终的结果。
下图显示了发送到应用程序的请求总数。

6.运行Prometheus
在本地运行Prometheus最合适的方法显然是通过Docker容器。在端口9090下公开API。我们还应该传递初始配置文件和Docker网络的名称。为什么这么做呢?在本步骤说明的下一部分,你就会找到答案。
docker run -d --name prometheus -p 9090:9090-v /tmp/prometheus.yml:/etc/prometheus/prometheus.yml --network springboot prom/prometheus
与InfluxDB相比,Prometheus从应用程序中拉取指标。因此,我们需要启用暴露Prometheus指标的actuator端点,默认情况下它是禁用的。要启用它,需要设置属性
management.endpoint.prometheus.enabled设置为 true,部分配置如下:management:endpoint:prometheus:enabled:true
然后我们应该在Prometheus配置文件中设置应用程序暴露的actuator端点的地址。一个scrape_config部分负责指定一组目标和参数,描述如何与它们连接。默认情况下,Prometheus会尝试每分钟从定义的目标端点收集数据。
scrape_configs:- job_name:'springboot'metrics_path:'/actuator/prometheus'static_configs:- targets:['person-service:2222']
与InfluxDB的集成类似,我们需要将以下组件包含在项目的依赖项中。
<dependency><groupId>io.micrometer</groupId><artifactId>micrometer-registry-prometheus</artifactId></dependency>
在我的例子中,Docker在VM上运行,并且通过IP 192.168.99.100下访问。如果我想要用Docker容器启动Prometheus,并能够连接应用程序,那我也应该在Docker容器中启动应用程序。连接两个独立容器的最方便方法便是通过Docker网络。如果两个容器都分配到同一网络,则它们可以使用容器的名称作为目标地址相互连接。 Dockerfile位于示例应用程序源代码的根目录中。下面显示的第二个命令(
docker build)不是必需的,因为我的Docker Hub仓库中提供了所需的图像 piomin/person-service$ docker network create springboot$ docker build -t piomin/person-service .$ docker run -d --name person-service -p 2222:2222--network springboot piomin/person-service
7.将Prometheus与Grafana整合
Prometheus在地址192.168.99.100:9090下公开Web console,你可以在其中指定带有指标的查询和图形显示。但是,我们可以将它与Grafana集成,利用Grafana提供更好的可视化。首先,创建Prometheus数据源。

然后我们应该定义从Prometheus API收集指标的查询。Spring Boot Actuator公开了三种与HTTP流量相关的不同指标:
http_server_requests_seconds_count, http_server_requests_seconds_sum和 http_server_requests_seconds_max。例如,我们可以计算 http_server_requests_seconds_sum的时间序列的每秒平均增长率,它返回使用 rate()函数处理请求所花费的总秒数。可以使用 {}过滤方法和uri内的表达式的值。下图说明了每个端点的 rate()函数配置。
如图所示:

8.总结
Spring Boot版本1.5和2.0之间的指标生成的改进具有重大意义。将数据导出到诸如InfluxDB或Prometheus之类的流行监控系统现在比以前容易得多,并且不需要任何额外的开发。由于标记表示HTTP请求的uri、类型和状态,与HTTP流量相关的指标更加详细,因此它们更容易与特定端点关联。与早期版本Spring Boot的相比,Spring Boot Actuator可能是将应用程序迁移到最新版本的一个主要原因。
原文链接: https://piotrminkowski.wordpress.com/2018/05/11/exporting-metrics-to-influxdb-and-prometheus-using-spring-boot-actuator/
作者:piotrminkowski
译者:complone

动手扫一扫关注,帮你不断突破技术壁垒
阅读原文 最新评论
推荐文章
作者最新文章
你可能感兴趣的文章
Copyright Disclaimer: The copyright of contents (including texts, images, videos and audios) posted above belong to the User who shared or the third-party website which the User shared from. If you found your copyright have been infringed, please send a DMCA takedown notice to [email protected]. For more detail of the source, please click on the button "Read Original Post" below. For other communications, please send to [email protected].
版权声明:以上内容为用户推荐收藏至CareerEngine平台,其内容(含文字、图片、视频、音频等)及知识版权均属用户或用户转发自的第三方网站,如涉嫌侵权,请通知[email protected]进行信息删除。如需查看信息来源,请点击“查看原文”。如需洽谈其它事宜,请联系[email protected]。
版权声明:以上内容为用户推荐收藏至CareerEngine平台,其内容(含文字、图片、视频、音频等)及知识版权均属用户或用户转发自的第三方网站,如涉嫌侵权,请通知[email protected]进行信息删除。如需查看信息来源,请点击“查看原文”。如需洽谈其它事宜,请联系[email protected]。