机器学习(9)之ID3算法详解及python实现
微信公众号
关键字全网搜索最新排名
【机器学习算法】:排名第一
【机器学习】:排名第二
【Python】:排名第三
【算法】:排名第四
前言
决策树算法在机器学习中算是很经典的算法系列。它既可以作为分类算法,也可以作为回归算法,同时也特别适合集成学习比如随机森林。本文就对决策树算法ID3思想做个总结。
ID3算法的信息论基础
1970年代,一个叫昆兰的大牛找到了用信息论中的熵来度量决策树的决策选择过程,它的简洁和高效就引起了轰动,昆兰把这个算法叫做ID3。下面我们就看看ID3算法是怎么选择特征的。
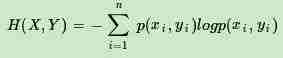
首先,我们需要熟悉信息论中熵的概念。熵度量了事物的不确定性,越不确定的事物,它的熵就越大。具体的,随机变量X的熵的表达式如下:

其中n代表X的n种不同的离散取值。而pi代表了X取值为i的概率,log为以2或者e为底的对数。
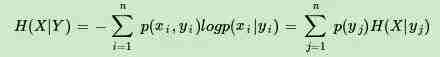
熟悉了一个变量X的熵,很容易推广到多个个变量的联合熵,这里给出两个变量X和Y的联合熵表达式:
有了联合熵,又可以得到条件熵的表达式H(X|Y),条件熵类似于条件概率,它度量了我们的X在知道Y以后剩下的不确定性。表达式如下:
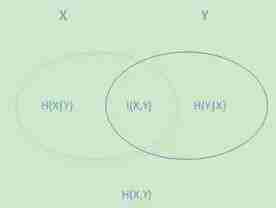
上面刚才提到H(X)度量了X的不确定性,条件熵H(X|Y)度量了我们在知道Y以后X剩下的不确定性,那么H(X)-H(X|Y)呢?它度量了X在知道Y以后不确定性减少程度,这个度量我们在信息论中称为互信息,记为I(X,Y)。在决策树ID3算法中叫做信息增益。ID3算法就是用信息增益来判断当前节点应该用什么特征来构建决策树。信息增益大,则越适合用来分类。
下面这个图可以比较清晰的反映他们之间的关系。左边的椭圆代表H(X),右边的椭圆代表H(Y),中间重合的部分就是我们的互信息或者信息增益I(X,Y), 左边的椭圆去掉重合部分就是H(X|Y),右边的椭圆去掉重合部分就是H(Y|X)。两个椭圆的并就是H(X,Y)。
ID3算法的思路
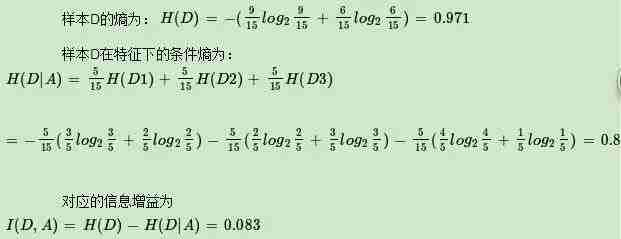
上面提到ID3算法就是用信息增益大小来判断当前节点应该用什么特征来构建决策树,用计算出的信息增益最大的特征来建立决策树的当前节点。这里我们举一个信息增益计算的具体的例子。比如我们有15个样本D,输出为0或者1。其中有9个输出为0, 6个输出为1。 样本中有个特征A,取值为A1,A2和A3。在取值为A1的样本的输出中,有3个输出为1, 2个输出为0,取值为A2的样本输出中,2个输出为1,3个输出为0, 在取值为A3的样本中,4个输出为1,1个输出为0.
输入的是m个样本,样本输出集合为D,每个样本有n个离散特征,特征集合即为A,输出为决策树T。
算法的过程为:
1)初始化信息增益的阈值ϵ
2)判断样本是否为同一类输出Di,如果是则返回单节点树T。标记类别为Di
3) 判断特征是否为空,如果是则返回单节点树T,标记类别为样本中输出类别D实例数最多的类别。
4)计算A中的各个特征(一共n个)对输出D的信息增益,选择信息增益最大的特征Ag
5) 如果Ag的信息增益小于阈值ϵ,则返回单节点树T,标记类别为样本中输出类别D实例数最多的类别。
6)否则,按特征Ag的不同取值Agi将对应的样本输出D分成不同的类别Di。每个类别产生一个子节点。对应特征值为Agi。返回增加了节点的数T。
7)对于所有的子节点,令D=Di,A=A−{Ag}递归调用2-6步,得到子树Ti并返回。
ID3算法的不足
ID3算法虽然提出了新思路,但是还是有很多值得改进的地方。
a) ID3没有考虑连续特征,比如长度,密度都是连续值,无法在ID3运用。这大大限制了ID3的用途。
b) ID3采用信息增益大的特征优先建立决策树的节点。很快就被人发现,在相同条件下,取值比较多的特征比取值少的特征信息增益大。比如一个变量有2个值,各为1/2,另一个变量为3个值,各为1/3,其实他们都是完全不确定的变量,但是取3个值的比取2个值的信息增益大。如果校正这个问题呢?
c) ID3算法对于缺失值的情况没有做考虑
d) 没有考虑过拟合的问题
ID3 算法的作者昆兰基于上述不足,对ID3算法做了改进,这就是C4.5算法。
python实现
实验数据来自【美】Peter Harrington 写的《Machine Learning in Action》
下载链接:http://pan.baidu.com/s/1jIR4wdg
或者加入微信交流群下载(二维码在文末)
trees.py
from math import log
import operator
def createDataSet():
dataSet = [[1, 1, 'yes'],
[1, 1, 'yes'],
[1, 0, 'no'],
[0, 1, 'no'],
[0, 1, 'no']]
labels = ['no surfacing','flippers']
#change to discrete values
return dataSet, labels
def calcShannonEnt(dataSet):
numEntries = len(dataSet)
labelCounts = {}
for featVec in dataSet: #the the number of unique elements and their occurance
currentLabel = featVec[-1]
if currentLabel not in labelCounts.keys(): labelCounts[currentLabel] = 0
labelCounts[currentLabel] += 1
shannonEnt = 0.0
for key in labelCounts:
prob = float(labelCounts[key])/numEntries
shannonEnt -= prob * log(prob,2) #log base 2
return shannonEnt
def splitDataSet(dataSet, axis, value):
retDataSet = []
for featVec in dataSet:
if featVec[axis] == value:
reducedFeatVec = featVec[:axis] #chop out axis used for splitting
reducedFeatVec.extend(featVec[axis+1:])
retDataSet.append(reducedFeatVec)
return retDataSet
def chooseBestFeatureToSplit(dataSet):
numFeatures = len(dataSet[0]) - 1 #the last column is used for the labels
baseEntropy = calcShannonEnt(dataSet)
bestInfoGain = 0.0; bestFeature = -1
for i in range(numFeatures): #iterate over all the features
featList = [example[i] for example in dataSet]#create a list of all the examples of this feature
uniqueVals = set(featList) #get a set of unique values
newEntropy = 0.0
for value in uniqueVals:
subDataSet = splitDataSet(dataSet, i, value)
prob = len(subDataSet)/float(len(dataSet))
newEntropy += prob * calcShannonEnt(subDataSet)
infoGain = baseEntropy - newEntropy #calculate the info gain; ie reduction in entropy
if (infoGain > bestInfoGain): #compare this to the best gain so far
bestInfoGain = infoGain #if better than current best, set to best
bestFeature = i
return bestFeature #returns an integer
def majorityCnt(classList):
classCount={}
for vote in classList:
if vote not in classCount.keys(): classCount[vote] = 0
classCount[vote] += 1
sortedClassCount = sorted(classCount.iteritems(), key=operator.itemgetter(1), reverse=True)
return sortedClassCount[0][0]
def createTree(dataSet,labels):
classList = [example[-1] for example in dataSet]
if classList.count(classList[0]) == len(classList):
return classList[0]#stop splitting when all of the classes are equal
if len(dataSet[0]) == 1: #stop splitting when there are no more features in dataSet
return majorityCnt(classList)
bestFeat = chooseBestFeatureToSplit(dataSet)
bestFeatLabel = labels[bestFeat]
myTree = {bestFeatLabel:{}}
del(labels[bestFeat])
featValues = [example[bestFeat] for example in dataSet]
uniqueVals = set(featValues)
for value in uniqueVals:
subLabels = labels[:] #copy all of labels, so trees don't mess up existing labels
myTree[bestFeatLabel][value] = createTree(splitDataSet(dataSet, bestFeat, value),subLabels)
return myTree
def classify(inputTree,featLabels,testVec):
firstStr = inputTree.keys()[0]
secondDict = inputTree[firstStr]
featIndex = featLabels.index(firstStr)
key = testVec[featIndex]
valueOfFeat = secondDict[key]
if isinstance(valueOfFeat, dict):
classLabel = classify(valueOfFeat, featLabels, testVec)
else: classLabel = valueOfFeat
return classLabel
def storeTree(inputTree,filename):
import pickle
fw = open(filename,'w')
pickle.dump(inputTree,fw)
fw.close()
def grabTree(filename):
import pickle
fr = open(filename)
return pickle.load(fr)
treePlotter.py
import matplotlib.pyplot as plt
decisionNode = dict(boxstyle="sawtooth", fc="0.8")
leafNode = dict(boxstyle="round4", fc="0.8")
arrow_args = dict(arrowstyle="<-")
def getNumLeafs(myTree):
numLeafs = 0
firstStr = myTree.keys()[0]
secondDict = myTree[firstStr]
for key in secondDict.keys():
if type(secondDict[key]).__name__=='dict':#test to see if the nodes are dictonaires, if not they are leaf nodes
numLeafs += getNumLeafs(secondDict[key])
else: numLeafs +=1
return numLeafs
def getTreeDepth(myTree):
maxDepth = 0
firstStr = myTree.keys()[0]
secondDict = myTree[firstStr]
for key in secondDict.keys():
if type(secondDict[key]).__name__=='dict':#test to see if the nodes are dictonaires, if not they are leaf nodes
thisDepth = 1 + getTreeDepth(secondDict[key])
else: thisDepth = 1
if thisDepth > maxDepth: maxDepth = thisDepth
return maxDepth
def plotNode(nodeTxt, centerPt, parentPt, nodeType):
createPlot.ax1.annotate(nodeTxt, xy=parentPt, xycoords='axes fraction',
xytext=centerPt, textcoords='axes fraction',
va="center", ha="center", bbox=nodeType, arrowprops=arrow_args )
def plotMidText(cntrPt, parentPt, txtString):
xMid = (parentPt[0]-cntrPt[0])/2.0 + cntrPt[0]
yMid = (parentPt[1]-cntrPt[1])/2.0 + cntrPt[1]
createPlot.ax1.text(xMid, yMid, txtString, va="center", ha="center", rotation=30)
def plotTree(myTree, parentPt, nodeTxt):#if the first key tells you what feat was split on
numLeafs = getNumLeafs(myTree) #this determines the x width of this tree
depth = getTreeDepth(myTree)
firstStr = myTree.keys()[0] #the text label for this node should be this
cntrPt = (plotTree.xOff + (1.0 + float(numLeafs))/2.0/plotTree.totalW, plotTree.yOff)
plotMidText(cntrPt, parentPt, nodeTxt)
plotNode(firstStr, cntrPt, parentPt, decisionNode)
secondDict = myTree[firstStr]
plotTree.yOff = plotTree.yOff - 1.0/plotTree.totalD
for key in secondDict.keys():
if type(secondDict[key]).__name__=='dict':#test to see if the nodes are dictonaires, if not they are leaf nodes
plotTree(secondDict[key],cntrPt,str(key)) #recursion
else: #it's a leaf node print the leaf node
plotTree.xOff = plotTree.xOff + 1.0/plotTree.totalW
plotNode(secondDict[key], (plotTree.xOff, plotTree.yOff), cntrPt, leafNode)
plotMidText((plotTree.xOff, plotTree.yOff), cntrPt, str(key))
plotTree.yOff = plotTree.yOff + 1.0/plotTree.totalD
#if you do get a dictonary you know it's a tree, and the first element will be another dict
def createPlot(inTree):
fig = plt.figure(1, facecolor='white')
fig.clf()
axprops = dict(xticks=[], yticks=[])
createPlot.ax1 = plt.subplot(111, frameon=False, **axprops) #no ticks
#createPlot.ax1 = plt.subplot(111, frameon=False) #ticks for demo puropses
plotTree.totalW = float(getNumLeafs(inTree))
plotTree.totalD = float(getTreeDepth(inTree))
plotTree.xOff = -0.5/plotTree.totalW; plotTree.yOff = 1.0;
plotTree(inTree, (0.5,1.0), '')
plt.show()
#def createPlot():
# fig = plt.figure(1, facecolor='white')
# fig.clf()
# createPlot.ax1 = plt.subplot(111, frameon=False) #ticks for demo puropses
# plotNode('a decision node', (0.5, 0.1), (0.1, 0.5), decisionNode)
# plotNode('a leaf node', (0.8, 0.1), (0.3, 0.8), leafNode)
# plt.show()
def retrieveTree(i):
listOfTrees =[{'no surfacing': {0: 'no', 1: {'flippers': {0: 'no', 1: 'yes'}}}},
{'no surfacing': {0: 'no', 1: {'flippers': {0: {'head': {0: 'no', 1: 'yes'}}, 1: 'no'}}}}
]
return listOfTrees[i]
#createPlot(thisTree)
测试代码:
import trees
import treePlotter
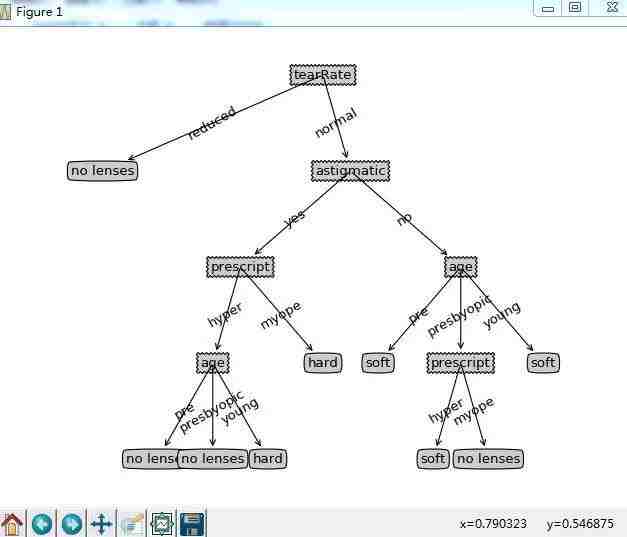
fr = open('lenses.txt')
lenses = [inst.strip().split('\t') for inst in fr.readlines()]
lensesLabels = ['age', 'prescript', 'astigmatic', 'tearRate']
lensesTree = trees.createTree(lenses, lensesLabels)
lensesTree
treePlotter.createPlot(lensesTree)
参考:
1. 周志华《机器学习》
2. http://www.cnblogs.com/pinard/p/6018889.html


招募 志愿者
广告、商业合作
请加QQ:[email protected]

喜欢,别忘关注~
帮助你在AI领域更好的发展,期待与你相遇!
最新评论
推荐文章
作者最新文章
你可能感兴趣的文章
Copyright Disclaimer: The copyright of contents (including texts, images, videos and audios) posted above belong to the User who shared or the third-party website which the User shared from. If you found your copyright have been infringed, please send a DMCA takedown notice to [email protected]. For more detail of the source, please click on the button "Read Original Post" below. For other communications, please send to [email protected].
版权声明:以上内容为用户推荐收藏至CareerEngine平台,其内容(含文字、图片、视频、音频等)及知识版权均属用户或用户转发自的第三方网站,如涉嫌侵权,请通知[email protected]进行信息删除。如需查看信息来源,请点击“查看原文”。如需洽谈其它事宜,请联系[email protected]。
版权声明:以上内容为用户推荐收藏至CareerEngine平台,其内容(含文字、图片、视频、音频等)及知识版权均属用户或用户转发自的第三方网站,如涉嫌侵权,请通知[email protected]进行信息删除。如需查看信息来源,请点击“查看原文”。如需洽谈其它事宜,请联系[email protected]。