干货 | 2017年Data Scientist面试必知的38道问题 (附答案解析)


Data相关的工作被称为“21世纪最性感的工作”,也是如今就业市场上的网红职位!
之前,小编帮大家总结了Data相关的八大职位详解,及各大硅谷科技公司data相关的面试题(戳这里👇)
这次,我们继续为有志成为Data Scientist的小伙伴们送上干货福利,权威总结2017年Data Science三十八道必知的面试问题和答案详解!

Q1. Explain what regularization is and why it is useful.
Q2. Which data scientists do you admire most? which startups?
Q3. How would you validate a model you created to generate a predictive model of a quantitative outcome variable using multiple regression.
Q4. Explain what precision and recall are. How do they relate to the ROC curve?
Q5. How can you prove that one improvement you've brought to an algorithm is really an improvement over not doing anything?
Q6. What is root cause analysis?
Q7. Are you familiar with pricing optimization, price elasticity, inventory management, competitive intelligence? Give examples.
Q8. What is statistical power?
Q9. Explain what resampling methods are and why they are useful. Also explain their limitations.
Q10. Is it better to have too many false positives, or too many false negatives? Explain.
Q11. What is selection bias, why is it important and how can you avoid it?
Q12. Give an example of how you would use experimental design to answer a question about user behavior.
Q13. What is the difference between "long" and "wide" format data?
Q14. What method do you use to determine whether the statistics published in an article (e.g. newspaper) are either wrong or presented to support the author's point of view, rather than correct, comprehensive factual information on a specific subject?
Q15. Explain Edward Tufte's concept of "chart junk."
Q16. How would you screen for outliers and what should you do if you find one?
Q17. How would you use either the extreme value theory, Monte Carlo simulations or mathematical statistics (or anything else) to correctly estimate the chance of a very rare event?
Q18. What is a recommendation engine? How does it work?
Q19. Explain what a false positive and a false negative are. Why is it important to differentiate these from each other?
Q20. Which tools do you use for visualization? What do you think of Tableau? R? SAS? (for graphs).
Q21. How to efficiently represent 5 dimension in a chart (or in a video)?
Q22.
What are Data Science lessons from failure to predict 2016 US Presidential election (and from Super Bowl LI comeback)
Q23. What problems arise if the distribution of the new (unseen) test data is significantly different than the distribution of the training data?
Q24. What are bias and variance, and what are their relation to modeling data?
Q25. Why might it be preferable to include fewer predictors over many?
Q26. What error metric would you use to evaluate how good a binary classifier is? What if the classes are imbalanced? What if there are more than 2 groups?
Q27. What are some ways I can make my model more robust to outliers?
Q28. What is overfitting and how to avoid it?
Q29. What is the curse of dimensionality?
Q30. How can you determine which features are the most important in your model?
Q31. When can parallelism make your algorithms run faster? When could it make your algorithms run slower?
Q32. What is the idea behind ensemble learning?
Q33. In unsupervised learning, if a ground truth about a dataset is unknown, how can we determine the most useful number of clusters to be?
Q34. What makes a good data visualization?
Q35. What are some of the common data quality issues when dealing with Big Data? What can be done to avoid them or to mitigate their impact?
Q36. In an A/B test, how can we ensure that assignment to the various buckets is truly random?
Q37. How would you conduct an A/B test on an opt-in feature?
Q38. How to determine the influence of a Twitter user?
由于完整答案篇幅较长,暂选取两个问题展示
想查看所有问题的答案解析?
后台回复“Data” 免费获取完整答案哦~
Explain what regularization is and why it is useful.
Regularization is the process of adding a tuning parameter to a model to induce smoothness in order to prevent overfitting. (see also KDnuggets posts on Overfitting)
This is most often done by adding a constant multiple to an existing weight vector. This constant is often either the L1 (Lasso) or L2 (ridge), but can in actuality can be any norm. The model predictions should then minimize the mean of the loss function calculated on the regularized training set.
Xavier Amatriain presents a good comparison of L1 and L2 regularization here, for those interested.

What are Data Science lessons from failure to predict 2016 US Presidential election
Just before the Nov 8, 2016 election, most pollsters gave Hillary Clinton an edge of ~3% in popular vote and 70-95% chance of victory in electoral college. Nate Silver's FiveThirtyEight had the highest chances of Trump Victory at ~30%, while New York Times Upshot and Princeton Election Consortium estimated only ~15%, and other pollsters like Huffington Post gave Trump only 2% chance of victory.

Still, Trump won. So what are the lessons for Data Scientists?
To make a statistically valid prediction we need
1) enough historical data and
2) assumption that past events are sufficiently similar to current event we are trying to predict.
Events can placed on the scale from deterministic (2+2 will always equal to 4) to strongly predictable (e.g. orbits of planets and moons, avg. number of heads when tossing a fair coin) to weakly predictable (e.g. elections and sporting events) to random (e.g. honest lottery).
If we toss a fair coin 100 million times, we have the expected number of heads (mean) as 50 million, the standard deviation =10,000 (using formula 0.5 * SQRT(N)), and we can predict that 99.7% of the time the expected number of heads will be within 3 standard deviations of the mean.
But using polling to predict the votes of 100 million people is much more difficult. Pollsters need to get a representative sample, estimate the likelihood of a person actually voting, make many justified and unjustified assumptions, and avoid following their conscious and unconscious biases.
In the case of US Presidential election, correct prediction is even more difficult because of the antiquated Electoral college system when each state (except for Maine and Nebraska) awards the winner all its votes in the electoral college, and the need to poll and predict results for each state separately.
The chart below shows that in 2016 US presidential elections pollsters were off the mark in many states. They mostly underestimated the Trump vote, especially in 3 critical states of Michigan, Wisconsin, and Pennsylvania which all flipped to Trump.
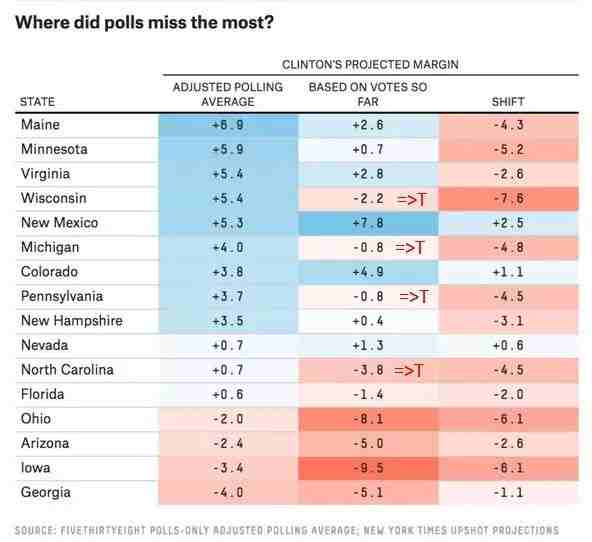
Source: @NateSilver538 tweet, Nov 9, 2016.
A few statisticians like Salil Mehta @salilstatistics were warning about unreliability of polls, but most pollsters were way off.
So a good lesson for Data Scientists is to question their assumptions and to be very skeptical when predicting a weakly predictable event, especially when based on human behavior.
Other important lessons are:
Examine data quality - in this election polls were not reaching all likely voters.
Beware of your own biases: many pollsters were likely Clinton supporters and did not want to question the results that favored their candidate. For example, Huffington Post had forecast over 95% chance of Clinton Victory.
▽
We had another example of statistically very unlikely event happen in Super Bowl LI on Feb 5, 2017. After the half time, Atlanta Falcons were leading 21:3 after halftime and 28:9 after 3rd quarter. ESPN estimated Falcons win probability at that time at almost 100%.

(reference: Salil Mehta tweet Salil Mehta tweet, Feb 6, 2017)
Never before has a team lost a Super Bowl after holding such advantage. However, each Super Bowl is different, and this one was turned out to be very different. Combination of superior skill (Patriots, after all, were favorites before the game) and luck (e.g. a very lucky catch by Julian Edelman in 4th quarter, Patriots winning coin toss in overtime) gave victory to Pats.
This Super Bowl was another good lesson for Data Scientists of danger of having too much confidence when predicting weakly predictable events. You need to understand the risk factors when dealing with such events, and try to avoid using probabilities, or if you have to use numbers, have a wide confidence range.
Finally, if the odds seem to be against you but the event is only weakly predictable, go ahead and do your best - sometimes you will be able to beat the odds.
想看所有问题的答案解析?
关注WE Career公众号
后台回复“Data” 免费获取完整答案~

推荐阅读
WE Career
北美最大华人职业发展平台


WE STEP UP YOUR CAREER
最新评论
推荐文章
作者最新文章
你可能感兴趣的文章
Copyright Disclaimer: The copyright of contents (including texts, images, videos and audios) posted above belong to the User who shared or the third-party website which the User shared from. If you found your copyright have been infringed, please send a DMCA takedown notice to [email protected]. For more detail of the source, please click on the button "Read Original Post" below. For other communications, please send to [email protected].
版权声明:以上内容为用户推荐收藏至CareerEngine平台,其内容(含文字、图片、视频、音频等)及知识版权均属用户或用户转发自的第三方网站,如涉嫌侵权,请通知[email protected]进行信息删除。如需查看信息来源,请点击“查看原文”。如需洽谈其它事宜,请联系[email protected]。
版权声明:以上内容为用户推荐收藏至CareerEngine平台,其内容(含文字、图片、视频、音频等)及知识版权均属用户或用户转发自的第三方网站,如涉嫌侵权,请通知[email protected]进行信息删除。如需查看信息来源,请点击“查看原文”。如需洽谈其它事宜,请联系[email protected]。